

web-vitals库获取的用户体验数据可以满足我们量化用户体验的部分需求,但是如果我们有更特殊、更个性化的数据收集需求,Performance API 就是我们不可或缺的好帮手。
Performance API 是一组在浏览器平台测量和收集性能数据的接口,它允许开发者访问页面加载、资源获取、用户交互、JavaScript执行等性能相关的数据。
灵活运用 Performance API 有助于我们将用户的主观体验量化为客观指标,建立以用户为中心的数据监控,更是我们后续开展众多优化后,评估优化效果的主要手段。
1. 基础性能记录类 class PerformanceEntry#
在浏览器中基于 Performance API 获取的各类性能记录都是PerformanceEntry类的子类实例,常用的主要有以下3类:
| 子类 | 简介 | 示例 |
|---|---|---|
PerformanceResourceTiming | JS、CSS、Image等各类资源加载相关数据,包括: - 资源名称,即URL: name- 资源类型: initiatorType,值共有9项:document, script, link, stylesheet, img, media, font, xhr, fetch。- DNS查询开始、完成耗时(单位:毫秒,下同): domainLookupStart、domainLookupEnd- HTTP请求开始耗时: requestStart- HTTP响应开始、完成耗时: responseStart 、responseEnd- 资源加载总耗时: duration- 响应体体积(单位:字节 byte): encodedBodySize- 传输体积(单位:字节 byte): transferSize- …… PerformanceResourceTiming几乎可以获取DevTool 的 Network 网络面板中能看到的所有数据。 注意requestStart,transferSize,connectStart等许多属性的获取都有同源策略限制,如果响应域名不同源,需要资源的HTTP响应包含响应头Timing-Allow-Origin: *,否则获取到的transferSize值会始终为0。所以,如果要获取这些值,别忘了给CDN添加该响应头,例如阿里云自定义HTTP响应头。 或者参考后文中的第5小节《CDN最佳实践》,尝试将将CDN域名配置为同源的解决方案。 | { "name": "https://www.google-analytics.com/analytics.js", "entryType": "resource", "startTime": 508.5, "duration": 4.399999618530273, "initiatorType": "script", "nextHopProtocol": "", "renderBlockingStatus": "non-blocking", "workerStart": 0, "redirectStart": 0, "redirectEnd": 0, "fetchStart": 508.5, "domainLookupStart": 0, "domainLookupEnd": 0, "connectStart": 0, "secureConnectionStart": 0, "connectEnd": 0, "requestStart": 0, "responseStart": 0, "firstInterimResponseStart": 0, "responseEnd": 512.8999996185303, "transferSize": 0, "encodedBodySize": 0, "decodedBodySize": 0, "responseStatus": 0, "serverTiming": [] } |
PerformanceEventTiming | 主要包含2类指标: - 首次输入 "first-input"相关数据,是WebVitals库中First Input Delay, FID指标的数据来源。- 慢响应事件相关数据:click、input、mousedown 等各类响应耗时超过104ms的输入事件。主要用于统计页面中响应较慢、影响用户体验的事件处理逻辑。 > 104ms为默认值,可通过 durationThreshold 调整 | { "name": "pointerdown", "entryType": "first-input", "startTime": 11995.60000038147, "duration": 0, "processingStart": 11996.39999961853, "processingEnd": 11996.60000038147, "cancelable": true } |
VisibilityStateEntry | 页面可视化状态变化数据指标,会在页面所属标签页在切换到前后台时分别记录值为"name": "visible"和"name": "hidden"的一条PerformanceEntry记录。> 这类指标于2023年7月发布的 Chrome 115版本率先实现,目前仍处于实验状态,后续可能会有所调整。 | { "name": "visible", "entryType": "visibility-state", "startTime": 4362.800000190735, "duration": 0 } |
注:在
PerformanceResourceTiming类型的记录中,
encodedBodySize:表示服务器响应的,未被压缩(例如Gzip压缩)的响应体大小。decodedBodySize:表示服务器响应的,已被压缩的响应体大小。以上2个属性只包括响应体的大小,不包括响应头的大小。 单位均为字节 byte。
transferSize:表示从服务器响应的响应头和响应体的总体积。单位也为字节 byte。因此,
encodedBodySize和decodedBodySize之间的区别在于是否解压缩,而transferSize则包括了响应头和响应体的所有内容。
此外,还有几类性能记录,也是web-vitals库各指标的来源,分别是:
LayoutShift:意外布局变化,对应CLS指标。LargestContentfulPaint:最大内容绘制,对应LCP指标。PerformancePaintTiming:绘制时间点,是FCP指标的数据来源
各属性对应流程图#
下图形象具体地说明了PerformanceResourceTiming各属性的时序关系:
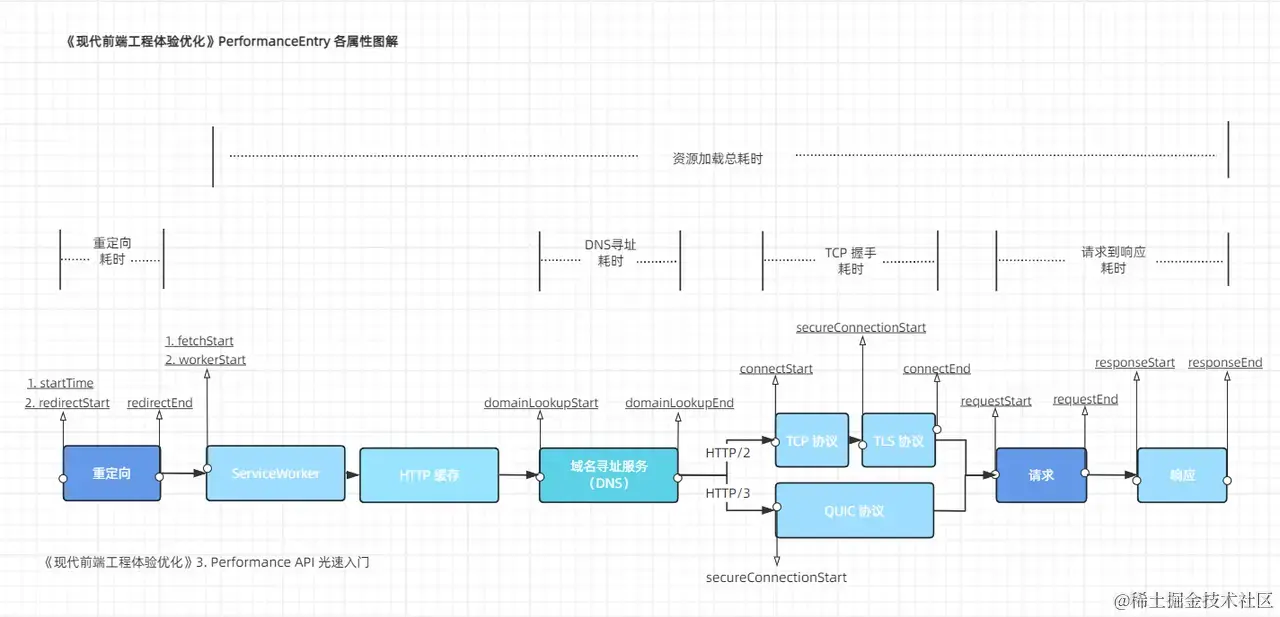
如果想计算一个资源的资源加载总耗时,就可以找到其性能记录,用responseEnd 减去 fetchStart 得到。
同样的,如果想计算一条性能记录的TCP握手耗时,可以用connectEnd 减去 connectStart 得到。
基于以上各类性能记录,我们可以细致入微地获取浏览器平台的性能表现和用户体验数据,后面的章节也会进一步结合具体场景,介绍缓存命中率、加载资源总体积等量化指标的实现和用法。
2. 自定义性能记录创建方法:.mark() && .measure()#
除了上述浏览器原生的性能记录,我们还可以通过performance.mark() && performance.measure()方法创建自定义的性能记录。
mark(strName, markOptions)用于创建性能记录。其第一个参数是节点ID,类型为字符串,第二个参数中的markOptions.detail可用于记录任意自定义数据。measure(strName, measureOptions)用于测量2个性能记录之间的时间差。第二个参数measureOptions可以指定任意自定义数据(.detail)以及,测量目标的开始、结束性能记录ID字符串。
这2个方法,都会创建一个PerformanceEntry子类的实例,并保存在当前运行环境的性能记录缓冲区中。
1. .mark() 使用示例#
performance.mark("login-started", {
  detail: { href: location?.href },
});

performance.mark("login-finished", {
  detail: { loginType: 'email' },
});
上述2行代码会在性能记录缓冲区中,添加2个性能记录,供我们后续再次获取、计算,其数据格式为:
{
    detail: { href: '...' }
    name: "login-started",
    entryType: "mark",
    startTime: 4545338.199999809,
    duration: 0
}.mark()方法是统一的标准化API,并且可以在任意模块的任意位置调用,不受源码模块化结构的影响。比我们手动写代码逻辑,来实现记录开始、结束时间点要更规范、更好用。
2. .measure()使用示例#
调用.measure()方法则可以基于已经添加的2个性能记录,计算这2个记录的间隔时间duration:
performance.measure("login-duration", {
  detail: { userRegion: 'cn' },
  start: 'login-started',
  end: 'login-finished',
});
执行后,会向性能记录缓冲区中添加如下格式的性能记录数据:
{
    detail: { userRegion: '...' }
    name: "login-duration",
    entryType: "measure",
    startTime: 4545338.199999809,
    duration: 275118.69999980927
}
注意:如果调用
measure()时,传入的开始、结束记录不存在,会抛出错误Uncaught DOMException: Failed to execute 'measure' on 'Performance': The mark 'not-exist-mark-name' does not exist.,导致代码执行中断。使用方式虽然灵活,也要注意规避这类异常情况。
Node.js 中也有
mark(),measure()这2项API,可用于测量Node.js服务器应用的响应耗时等指标
这2个方法创建的PerformanceEntry数据,也可以通过下文的getEntries和PerformanceObserverAPI和原生性能记录一并获取。
3. 获取性能记录方法:.getEntries()&& new PerformanceObserver()#
上述性能记录都会记录在运行时的性能记录缓冲区中,通过以下2类方法即可获取到:
1. 回调监听式持续获取#
这类方法具体指(new PerformanceObserver(observeCallbackFunc)).observe(),其中的observeCallbackFunc回调函数会在新的性能记录添加时触发,接收到2个参数(list, observer),list即新增性能记录组成的数组,完整示例如下:
// 1. 创建一个PerformanceObserver实例
const observer = new PerformanceObserver((list) => {
  const entries = list.getEntries();
  entries.forEach((entry) => {
    console.log(`资源名称: ${entry.name}`);
    console.log(`资源类型: ${entry.initiatorType}`);
    console.log(`资源加载时间: ${entry.duration}ms`);
  });
});

// 2. 指定要观察的性能条目类型(下文为全部类型)
const entryTypes = [       // 对应上文的性能记录子类:
    "resource",            // PerformanceResourceTiming
    "visibility-state",    // VisibilityStateEntry
    "mark",                // PerformanceMark
    "measure",             // PerformanceMeasure
    "event",
    "element",
    "first-input",
    "largest-contentful-paint",
    "layout-shift",
    "longtask",
    "navigation",
    "paint",
    "taskattribution",
];

// 3. 启动 PerformanceObserver 来观察指定类型的性能条目
observer.observe({ entryTypes });

// 4. 停止观察
observer.disconnect();
注意:调用
.observe()前,已经触发的性能记录,不会被监听到,这类记录建议使用下文的第2类方法获取。
2. 立刻返回当前所有记录#
这类方法具体指以下3个API:
performance.getEntries()performance.getEntriesByName(nameStr, typeStr)performance.getEntriesByType(typeStr)
这三个方法,会立刻返回当前性能记录缓冲区中的所有性能记录。
getEntriesByName和getEntriesByType还可以通过参数,过滤出指定的名称和类型
performance.getEntries()    // PerformanceEntry: []

performance.getEntriesByName("login-started", "mark");     // PerformanceMark: []

performance.getEntriesByType("resource");    // PerformanceResourceTiming: []
4. 示例:统计并可视化资源加载耗时#
基于PerformanceEntry,我们可以获取到资源加载各阶段的数据,从而建立资源加载耗时指标,用于量化和评估各类优化的效果。
1. 代码示例#
<!DOCTYPE html>
<html lang="en">
  <head>
    <meta charset="UTF-8" />
    <meta name="viewport" content="width=device-width, initial-scale=1.0" />
    <title>资源加载耗时DEMO</title>
    <link
      rel="prefetch"
      href="https://static.zhihu.com/heifetz/6116.216a26f4.7e059bd26c25b9e701c1.css"
    />
  </head>
  <body>
    <h1>
      <a href="https://juejin.cn/post/7274889579076108348">
      《1.4秒到0.4秒-2行代码让JS加载耗时减少67%-《现代前端工程体验优化》-第二章-第一节》
      </a>
    </h1>
    <img
      src="https://p1-juejin.byteimg.com/tos-cn-i-k3u1fbpfcp/5abdb9a058574c2e84c09883ac65541d~tplv-k3u1fbpfcp-jj-mark:0:0:0:0:q75.image#?w=972&h=550&s=79523&e=png&b=ffffff"
    />
    <script>
      async function reportGauge(name, help, labels, value) {
        await fetch('http://localhost:4001/gauge-metric', {
          method: 'POST',
          headers: {
            'Content-Type': 'application/json',
          },
          body: JSON.stringify({
            name,
            help,
            labels,
            value,
          }),
        });
      }

      // https://developer.mozilla.org/en-US/docs/Web/API/PerformanceResourceTiming
      const ResourceTiming = {
        DNSLookupTime: ['domainLookupEnd', 'domainLookupStart'],
        TCPHandshakeTime: ['connectEnd', 'connectStart'], // 也适用于QUIC协议
        TLSNegotiationTime: ['requestStart', 'secureConnectionStart'],
        requestToResponseTime: ['responseEnd', 'requestStart'],
      };

      function getConnectionData(entry) {
        let data = {};
        Object.keys(ResourceTiming).forEach((name) => {
          const [end, start] = ResourceTiming[name];
          data[name] = entry[end] - entry[start];
        });
        return data;
      }

      function getCDNMetric() {
        const entries = performance.getEntriesByType('resource');
        entries.forEach((entry) => {
          const entryName = entry.name;
          const connectionData = getConnectionData(entry);
          console.log(
            `connectionData=${JSON.stringify(connectionData, null, 2)}`
          );
          Object.keys(connectionData).forEach((name) => {
            reportGauge(
              name,
              `frontend data of ${name}`,
              {
                entryName,
                id: Date.now(),
              },
              connectionData[name]
            );
          });
        });
      }

      setTimeout(() => {
        getCDNMetric();
      }, 3000);
    </script>
  </body>
</html>
在上述示例,我们:
调用封装在
function getCDNMetric()中的performance.getEntriesByType('resource')API,用于获取已加载资源的性能记录数据PerformanceResourceTiming。在页面加载完成后(此处用
setTimeout模拟这一时间点),调用getCDNMetric(),遍历检查资源加载的性能记录数据,获取其:- URL(
name) - DNS寻址耗时(DNSLookupTime):
domainLookupEnd减去domainLookupStart - TCP握手耗时(TCPHandshakeTime):
connectEnd减去secureConnectionStart - 请求到响应耗时(requestToResponseTime):
responseEnd减去requestStart,等指标。
- URL(
最后将上述统计数据,通过
function reportGauge(metricData)方法,以HTTP请求的形式,上报到我们的数据收集后端服务,并最终转发到Grafana。
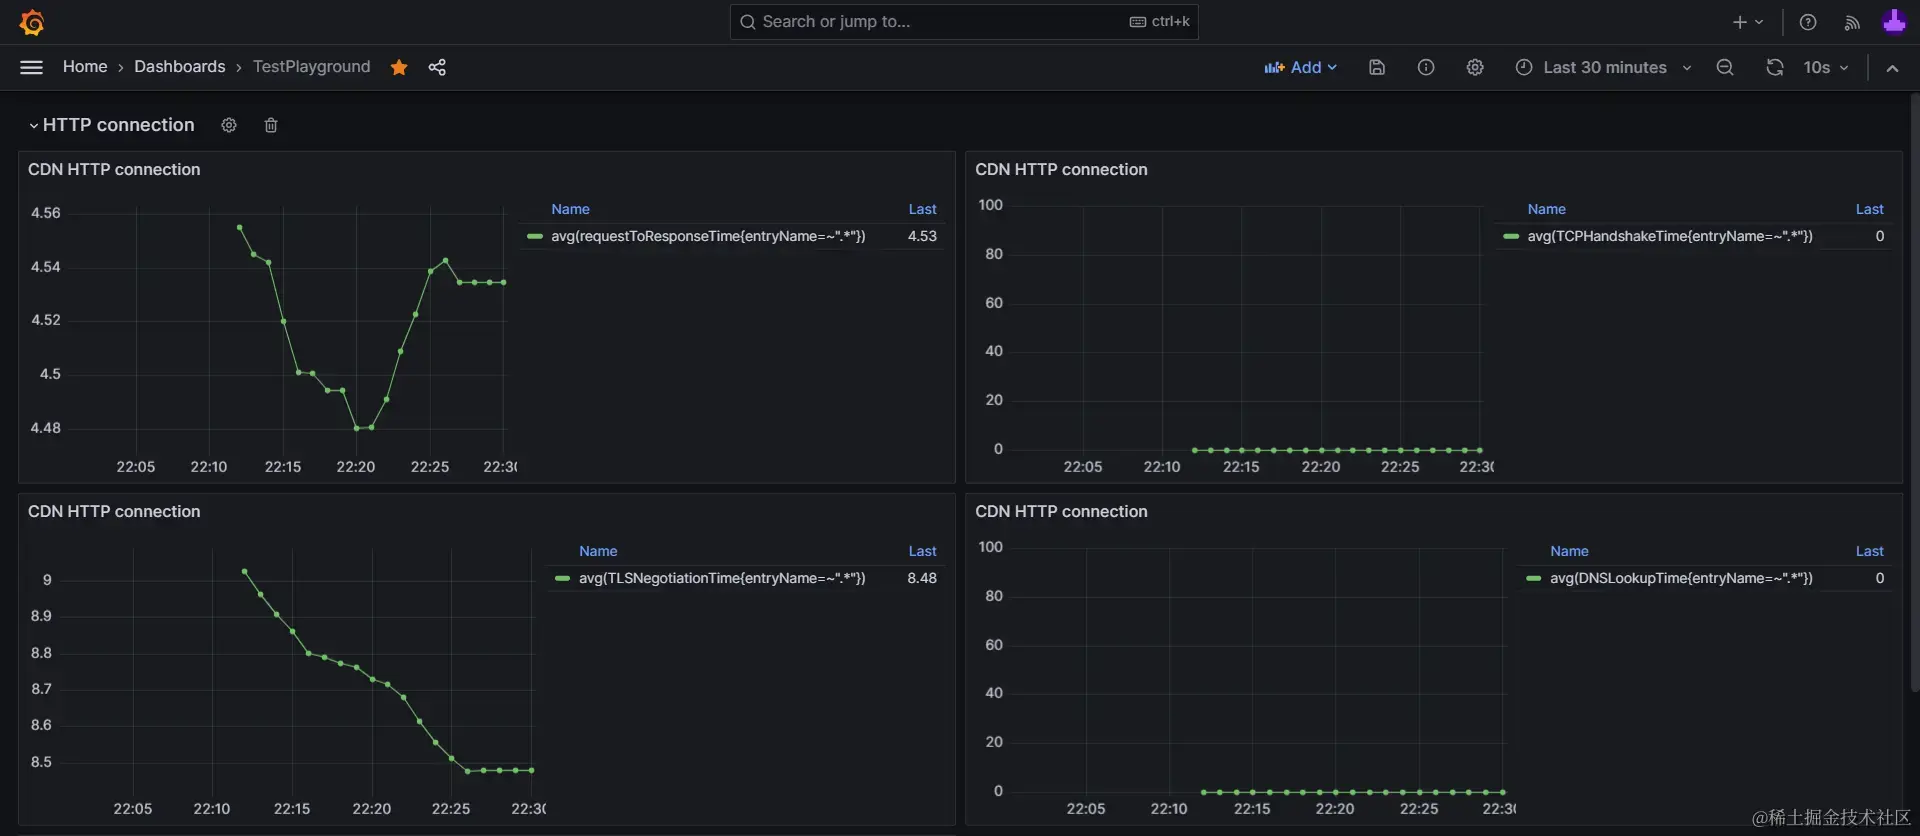
有了这些数据,我们就可以进一步在Grafana中,进行数据可视化,统计出这些指标的变化情况,用于量化我们的优化效果:
▶点击展开:《CDN域名连接耗时指标》Grafana可视化图表配置源码
{
  "datasource": {
    "uid": "grafanacloud-prom",
    "type": "prometheus"
  },
  "fieldConfig": {
    "defaults": {
      "custom": {
        "drawStyle": "line",
        "lineInterpolation": "linear",
        "barAlignment": 0,
        "lineWidth": 1,
        "fillOpacity": 0,
        "gradientMode": "none",
        "spanNulls": false,
        "insertNulls": false,
        "showPoints": "auto",
        "pointSize": 5,
        "stacking": {
          "mode": "none",
          "group": "A"
        },
        "axisPlacement": "auto",
        "axisLabel": "",
        "axisColorMode": "text",
        "axisBorderShow": false,
        "scaleDistribution": {
          "type": "linear"
        },
        "axisCenteredZero": false,
        "hideFrom": {
          "tooltip": false,
          "viz": false,
          "legend": false
        },
        "thresholdsStyle": {
          "mode": "off"
        }
      },
      "color": {
        "mode": "palette-classic"
      },
      "mappings": [],
      "thresholds": {
        "mode": "absolute",
        "steps": [
          {
            "color": "green",
            "value": null
          },
          {
            "color": "red",
            "value": 80
          }
        ]
      },
      "unit": "ms"
    },
    "overrides": []
  },
  "gridPos": {
    "h": 8,
    "w": 12,
    "x": 0,
    "y": 9
  },
  "id": 19,
  "options": {
    "tooltip": {
      "mode": "single",
      "sort": "none"
    },
    "legend": {
      "showLegend": true,
      "displayMode": "table",
      "placement": "right",
      "calcs": [
        "last"
      ]
    }
  },
  "targets": [
    {
      "datasource": {
        "type": "prometheus",
        "uid": "grafanacloud-prom"
      },
      "disableTextWrap": false,
      "editorMode": "builder",
      "expr": "avg(requestToResponseTime{entryName=~".*"})",
      "fullMetaSearch": false,
      "includeNullMetadata": true,
      "instant": false,
      "legendFormat": "__auto",
      "range": true,
      "refId": "A",
      "useBackend": false
    }
  ],
  "title": "CDN HTTP connection",
  "type": "timeseries"
}
2. 采样率#
成熟前端应用的访问量、用户量往往达到数万甚至数百万,如果从用户的浏览器客户端采集大量数据,将会消耗服务器极大的带宽,硬盘空间等系统资源,对用户的流量也有相当大的开销。这是前端工程中统计数据的一大痛点。
采样是解决这一痛点的实用技巧。
在统计学中,采样是节省工作量的常用手段,通过从样本总体中均匀地采集部分数据,来推断整体的状态。
具体到本书中基于prom-client和HTTP接口的数据收集方式,实现采样的方式也很简单,只需要在调用reportGauge()方法上报数据时,基于Math.random()过滤部分数据上报即可,例如:
async function reportGauge({
        name,
        help,
        labels,
        value,
        sampleRate = 1,
      }) {
        if (Math.random() > sampleRate) {
          return;
        }
        // await fetch('http://localhost:4001/gauge-metric',
        // ...
}在这段代码中,我们为原有的reportGauge方法,增加了1个类型为数字,默认值为 1 的参数sampleRate作为采样率。
在函数执行时,会调用Math.random()获取一个随机值,如果:
- 随机值大于我们传入的指定采样率,就调用
return结束函数执行,不再上报这条数据。 - 相反,如果随机值小于我们指定的采样率,就正常上报这条数据。
使用时只需要使用一个[0, 1]左闭右闭区间内的数字值,就可以实现指定采样率的数据收集。
使用采样率,舍弃一部分数据,既不会影响我们统计的准确性,又能为用户节省流量,为服务器降低负载压力。
例如:
- 传入
sampleRate = 0.01,那么100次调用reportGauge数据上报方法。平均来说就只会上报1次,也就是1%采样率。 - 传入
sampleRate = 0.5,那么100次调用reportGauge数据上报方法。平均来说就只会上报50次,也就是50%采样率。
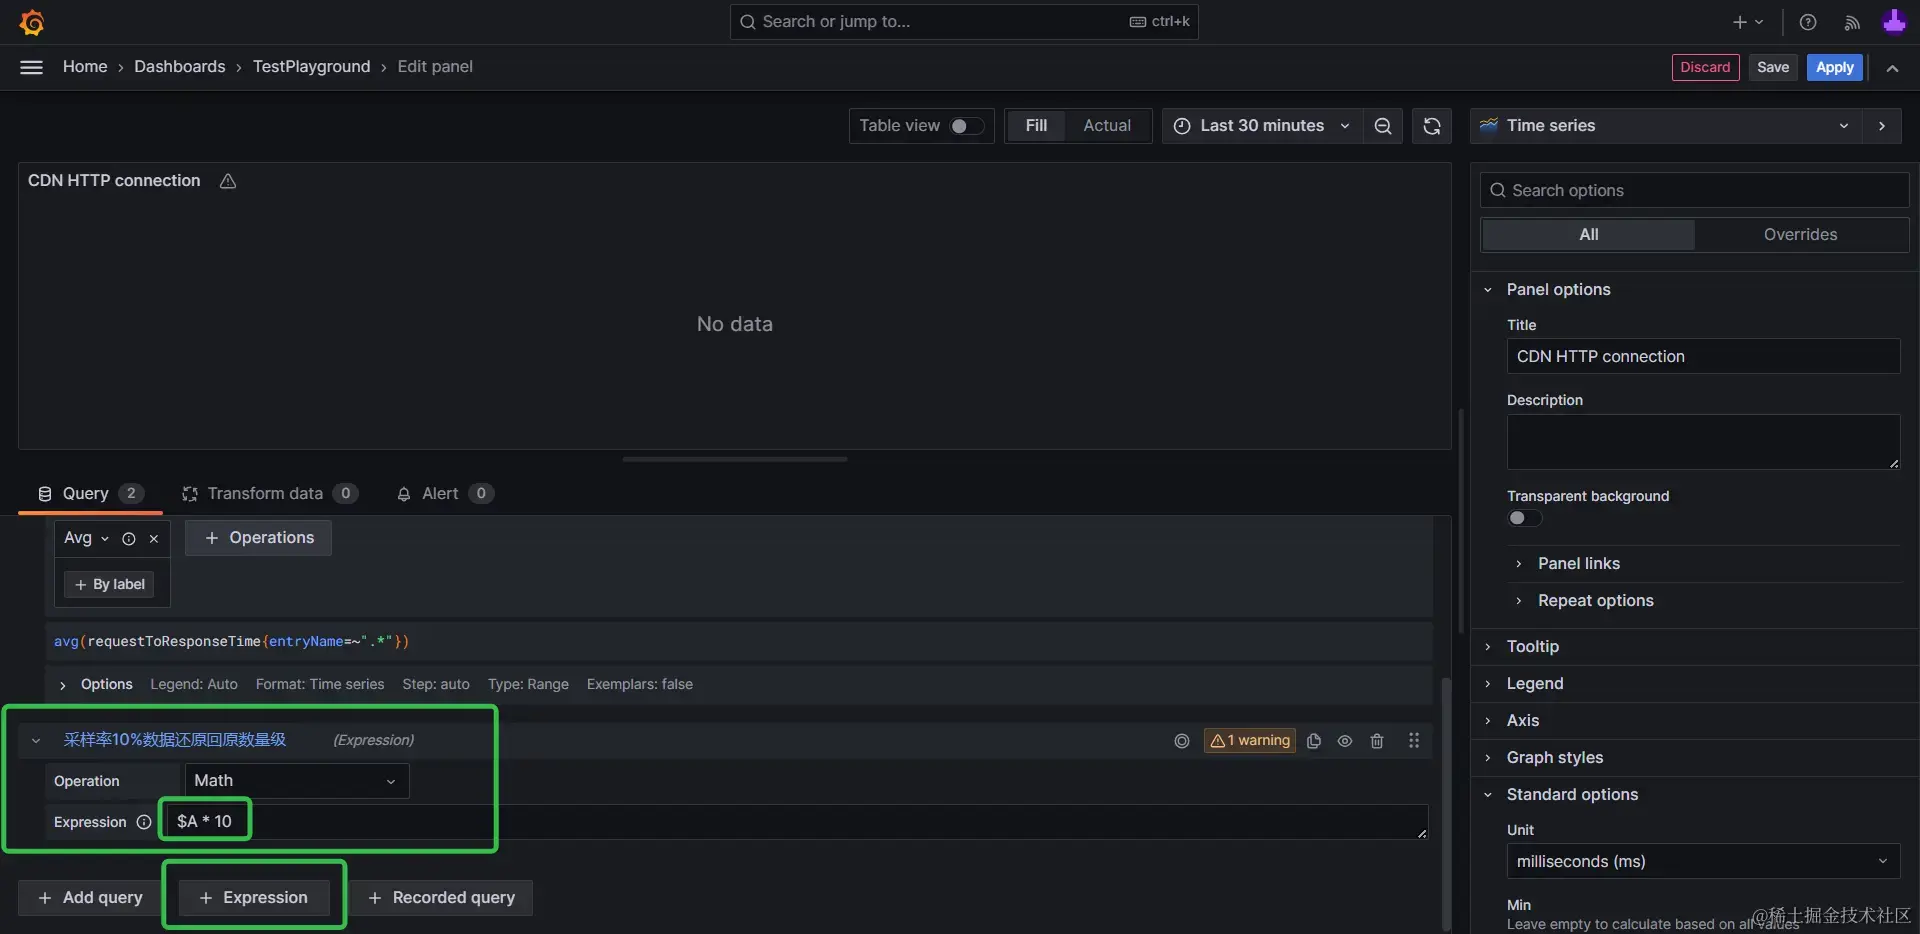
在对收集到的采样数据进行可视化或量化分析时,则可以通过乘以采样率对应倍数,将采样的部分数据还原回样本总量的量级。
例如sampleRate = 0.1,10%采样率收集的数据,在可视化时,通过Grafana的表达式查询能力,对数据乘以10,即可将数据还原回样本总量的量级。
小结#
在这一节中,我们学习了Performance API的3类主要用法:
- 基于
PerformanceEntry,获取资源加载耗时等各类性能记录。 - 用
.mark()&&.measure()创建自定义性能记录。 - 用
.getEntries()&&new PerformanceObserver(),获取当前性能记录缓冲区中的性能记录。
并进一步演示了用PerformanceEntry,统计并可视化资源加载耗时的方法,以及通过采样率减少数据采集开销的细节。